http://weblogs.asp.net/scottgu/archive/2007/07/31/linq-to-sql-debug-visualizer.aspx
Probably the biggest programming model improvement being made in .NET 3.5 is the work being done to make querying data a first class programming concept. We call this overall querying programming model "LINQ", which stands for .NET Language Integrated Query. Developers can use LINQ with any data source, and built-in libraries are included with .NET 3.5 that enable LINQ support against Objects, XML, and Databases.
Earlier this summer I started writing a multi-part blog series that discusses the built-in LINQ to SQL provider in .NET 3.5. LINQ to SQL is an ORM (object relational mapping) implementation that allows you to model a relational database using .NET classes. You can then query the database using LINQ, as well as update/insert/delete data from it. LINQ to SQL fully supports transactions, views, and stored procedures. It also provides an easy way to integrate data validation and business logic rules into your data model.
You can learn more about LINQ to SQL by reading my posts below (more will be coming soon):
- Part 1: Introduction to LINQ to SQL
- Part 2: Defining our Data Model Classes
- Part 3: Querying our Database
- Part 4: Updating our Database
- Part 5: Binding UI using the ASP:LinqDataSource Control
Using the LINQ to SQL Debug Visualizer
One of the nice development features that LINQ to SQL supports is the ability to use a "debug visualizer" to hover over a LINQ expression while in the VS 2008 debugger and inspect the raw SQL that the ORM will ultimately execute at runtime when evaluating the LINQ query expression.
For example, assume we write the below LINQ query expression code against a set of data model classes:

We could then use the VS 2008 debugger to hover over the "products" variable after the query expression has been assigned:

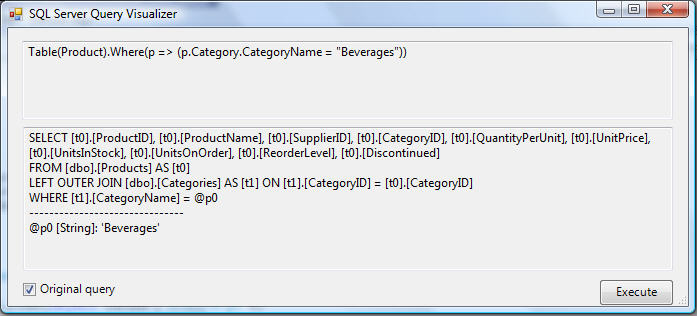
And if we click the small magnifying glass in the expression above, we can launch the LINQ to SQL debug visualizer to inspect the raw SQL that the ORM will execute based on that LINQ query:

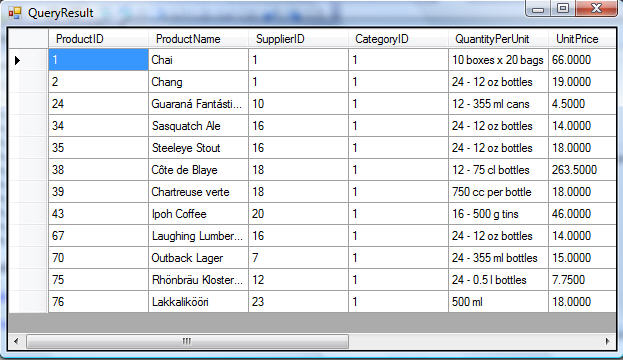
If you click the "Execute" button, you can even test out the SQL query and see the raw returned results that will be returned from the database:

This obviously makes it super easy to see precisely what SQL query logic LINQ to SQL ORM is doing for you.
You can learn even more about how all this works by reading the Part 3: Querying our Database segment in my LINQ to SQL series above.
How to Install the LINQ to SQL Debug Visualizer
The LINQ to SQL Debug Visualizer isn't built-in to VS 2008 - instead it is an add-in that you need to download to use. You can download a copy of it here.
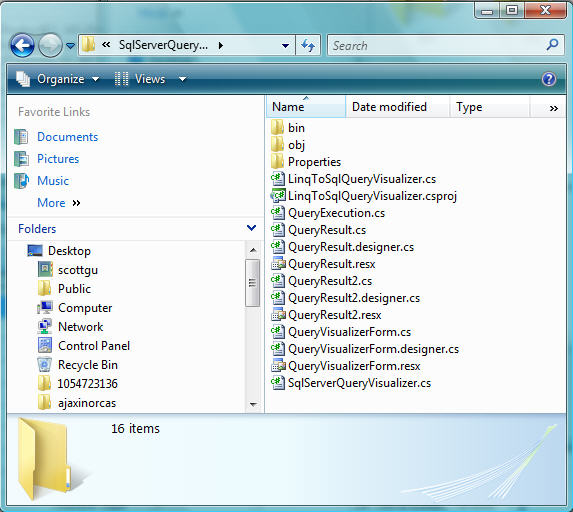
The download contains both a binary .dll assembly version of the visualizer (within the \bin\debug directory below), as well as all of the source code for the visualizer:

To install the LINQ to SQL debug visualizer, follow the below steps:
1) Shutdown all running versions of Visual Studio 2008
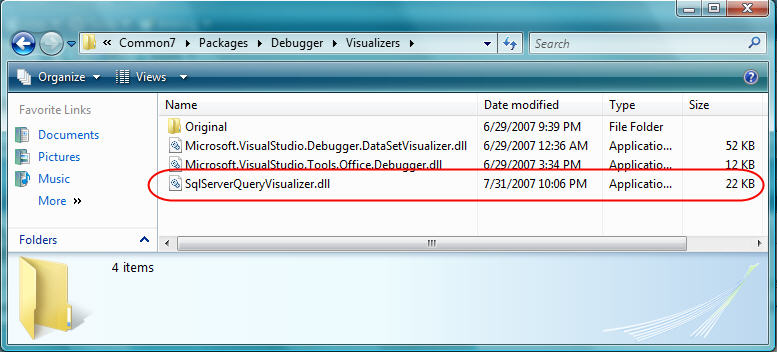
2) Copy the SqlServerQueryVisualizer.dll assembly from the \bin\debug\ directory in the .zip download above into your local \Program Files\Microsoft Visual Studio 9.0\Common7\Packages\Debugger\Visualizers\ directory:

3) Start up Visual Studio 2008 again. Now when you use the debugger with LINQ to SQL you should be able to hover over LINQ query expressions and inspect their raw SQL (no extra registration is required).
Hope this helps,
Scott

